June 17, 2011by Mark Rose- 0 comments
What 3 ducks can teach you about trading

I’ve never been a fan of having televisions dotted around the house. In Trader’s Bulletin Towers, if you’re watching TV, you have to do it as a family, huddled around the warmth of the box in the front room.
Of course, this does lead to some conflict between the five members of the household – the kids in particular.
Just when the youngest member of the household has settled down in front of CBeebies, in comes an older sibling who switches it over the Tracey Beaker. Occasionally, two of them will be in agreement, but rare are the moments of peace that come when all three are curled up on the sofa watching Scooby Doo.
Finding agreement
Whether you’re a parent, a United Nations negotiator – or a trader – you’ll know that agreement is something that cannot be forced.
Traders often ask me how they can find agreement across different timeframes on their charts. And which are the best timeframes to use – 1-minute charts … 5-minute charts … hourlies … dailies …?
It’s a common problem – you’ve just spotted an incredible set up on a price chart … you go to confirm the trend on a different timeframe … and it’s telling you a whole different story.
If you’re lucky, you might get two timeframes telling you the same story … but the third one lets you down.
The answer?
One solution would be to ignore the information that doesn’t fit in with the “story” you want to trade.
But picking and choosing the data we want on an ad hoc basis isn’t a sensible way to trade.
Using multiple timeframes can be a powerful way to confirm a trend – provided we do it right.
The long and the short of it
“Multiple timeframe analysis” is the fancy name we use for the simple process of looking at more than one chart.
Let’s say that we spot a trend on the hourly chart, then we go to a 5 minute chart to confirm that trend … that would be multiple timeframe analysis.
Longer timeframes are good for viewing overarching trends, without the background “noise” that show up on shorter timeframes.
However, shorter timeframes are useful to spotting the subtleties that tell us when to get in and out of a position.
It sounds simple, but when you put it into practice, it can be frustrating, and you’ll find yourself throwing out a lot of trade ideas that don’t make the cut.
What I’d like to look at today is a very simple strategy that uses multiple timeframe analysis to great effect – in my opinion, this is a great way to practise using different timeframes together, without overcomplicating the picture with extra technical analysis.
It’s also a strategy that can be very successful.
The 3 Ducks system – how to use it
You may have come across this system before.
It’s widely available on internet forums, and is free for anyone to use – there’s nothing secret about it.
But, unlike a lot of stuff you can find for free on the internet – it’s really quite good.
This is how it works …
The three “ducks” you need to have lined up for this trade are the 3 signals that tell you when to trade:
Duck 1: Check the 4-hour chart with a 60-period simple moving average. This is going to give us our overarching trend. If the price is above the 60 sma, then we’re going to be looking for a buy trade; if it’s below the 60 sma, we’ll be looking for a sell trade.
In this example, the price is below the 60sma, so we’ll be looking for a SELL trade:

Now on to our next duck …
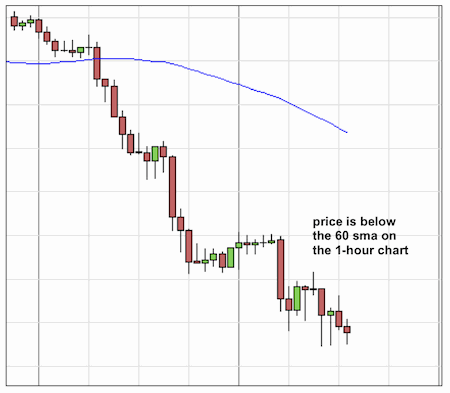
Duck 2: Next we move on to a 1-hour chart and look for confirmation of the trend. If the price is again below the 60sma, then our sell signal is confirmed. If it isn’t below the 60sma, then the two charts don’t agree and we don’t have a trading signal.
Here we can see that the price is again below the 60sma, so we have a sell signal:
So we move on to our third duck …
Duck 3: Now that the direction of the trend is confirmed, we will look to place our trade when the price crosses below the 60sma. For extra confirmation, you can choose to wait until it has also broken below the previous low on this chart:

That’s it!
… and why to use it …
Obviously, this is the bare bones, and to make this into a full strategy, you’ll need to define where you place your profit targets and stops.
For me, what this system illustrates perfectly is how multiple time frames can give you extra confidence about the way in which the market is moving – and can help you to optimize your entry level.
If you want to test yourself across different timeframes, you can do a lot worse that playing around with the 3 Ducks System.
I’d be interested to hear about how you get on.
Until next week,
Mark Rose