

Top Five Technical Tools
Yesterday I was reading an article about the value for business in making time for innovation. I’m not talking about brain-storming sessions, but just plain old empty space, where you can think. You know, the kind of thing you do when you’re chewing the end of your pencil, or gazing out of the window. Admittedly, most of the time, you’re just wondering what to have for lunch (or is that just me?), but occasionally, up pops the flicker of an idea.
Some businesses run “FedEx Days” – these are paid days off work with no agenda. You can do whatever you want with them. But there’s a catch – employees must deliver something of value 24 hours later.
So, as we’re always being told that we should run our trading like a business – isn’t it about time we had a FedEx moment?
One of the best ways to come up with innovative solutions for our trading is to be always be open to new ideas and looking at how other traders are using technical indicators. Which is why I’m hoping that this top-five list of technical indicators might spark up some trading light bulbs …
Five technical tools every trader should consider …
5. Moving averages:
Moving averages are the meat-and-potatoes of a technical trader’s diet. Sure, they’re dead simple, but they are highly regarded by experts.
A simple moving average is nothing more than the average closing price over a set number of periods. So a 20-day moving average would be the average closing price over the last 20 days.
Moving averages do a great job of smoothing out data, so we don’t get hung up on the little wobbles, but instead focus on the bigger picture.
Loosely speaking, if a price is rising, we expect it to be above the moving average; if it is falling, we expect it to be below the moving average.
Therefore, if a price crosses the moving average line, we can anticipate a change of trend. But where moving averages really come into their own is when you have two, or three, of them together.
So, where one moving average crosses the other, we have a signal of a trend change. One of the best things about a moving average crossover is that there’s no ambiguity – it’s a signal that you can’t miss.

4. Bollinger bands
If moving averages are the meat and potatoes, then Bollinger bands are organic fillet steak with new-season Jersey Royals. What I mean is, they’re moving averages with bells on.
What Bollinger bands give you that moving averages don’t is a very simple and practical snapshot of volatility, too.
This is what they look like:

The 20-period moving average is the blue line running through the middle, with the pink Bollinger bands either side. When volatility is high, the bands are far apart; when volatility is low, they are closer together.
I like to think of the moving average as a small stream; the Bollinger bands running either side are like the edge of the flood plain. Sometimes the flood plain is wider, sometimes it’s narrower. But when the water gets close to the edge of that flood plain – we need to take notice. Out come the sandbags, and the price direction is diverted.
3. RSI
Moving averages are all about trends, but when we’re stuck in a sideways market, a tool that can help us in sticky situations is the RSI.
The RSI is a momentum indicator that measures the speed of change of price movements. It is usually plotted between 1 and 100, and is considered “overbought” when above 70 or “oversold” when below 30.
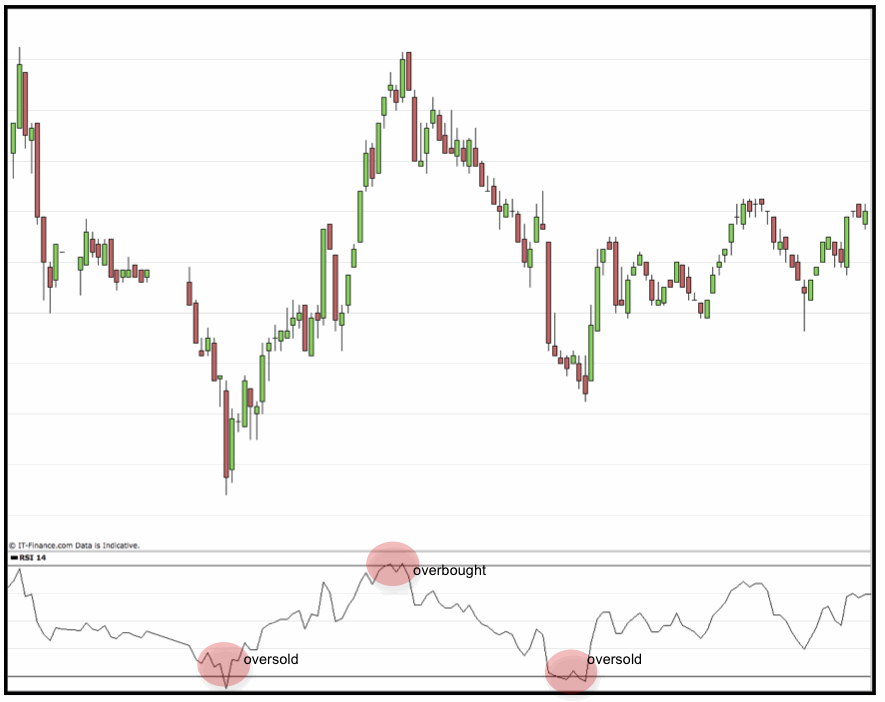
However, a more sophisticated way to use RSIs is to look for RSI divergence to tell us when a trend is running out of steam.

2. Pivot Points
Pivot points are five horizontal lines that you can draw on your chart every morning that give you some serious clues about which way the market will go … where it might bounce back or hesitate … and where you can expect a breakout to move to …
It only takes a few moments each morning to calculate these levels and mark them up on your chart.
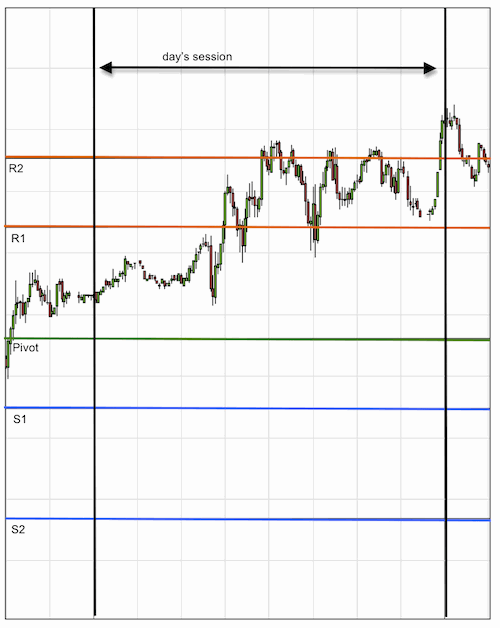
You can find lots more information about trading with Pivot Points in the Trader’s Bulletin guide here.
1. Fibonacci Retracements
If you’ve EVER placed a trade, chances are you’ve thought: “how far will this market move?”
It’s the question that follows all traders. Where should we take profits?
While Fibonacci retracements can’t give you an exact answer (unfortunately, no one can!), they do their damnedest to give you a helping hand.
They work by splitting a market move (i.e. the difference between a recent high and a recent low level) into the magical Fibonacci segments – and these will give you levels that the price will retrace to. If that sounds a little flakey, then the key thing to know is that millions of traders around the planet are doing exactly this – so, whether there’s anything magical about Fibonacci levels or not – the market reacts at these levels because they are littered with profit targets and stop losses.

So, if everyone else knows about these levels, and you’re not using them – then you’re missing a trick.
Whether you’re currently using Fibonacci levels or not, I strongly recommend that you watch out for the Fibonacci Masterclass coming next week. Our tame Fibonacci expert will be guiding you through the key things you need to know in two concise lessons on Wednesday and Friday.


JOIN US ...
Get full access to members-only resources, plus my weekly email updates ...
I will NEVER share your details for marketing purposes. Privacy policy
Strategies I'm Using
 It has taken 2 years to persuade this market…
- These videos show how to make 24% gains in…
 As you can see from all the data I've…
 Get the low down on the Heikin Ashi Mountain…





1 comment
Baz Brennan
thanks Mark, interesting educational article this week, the ‘flood plain’ analogy is very good.