November 30, 2012by Mark Rose- 3 comments
How to trade price action

“Price action” is very fashionable in trading right now.
And a lot of people ask me What is price action? How do I trade price action?
For a trading method that claims to simplify things, it can be surprisingly difficult to pin down what price action methods are, which is why I’d like to run through exactly what price action IS … what the key skills are that you need to learn … and how to put them into practice …
The price action myth
One of the big claims made by many price action traders is that they’ve “done away” with technical indicators.
Sure, they’ve cleaned up their charts, but let’s not kid ourselves – this style of trading is still about spotting patterns in charts that have worked in the past … and using that information to make decisions about future price behaviour.
This is still technical trading.
But with a difference.
Which brings us to the first task as a price action trader – spring cleaning those charts!
Remove the moving average lines … the Bollinger bands … the RSIs … all of them off.
So your charts might go from this …

To this …!

So, what do we do with these beautiful clean charts?
Well, yes, I’m afraid we start drawing lines on them!
And this gets to the nub of the ‘what is price action‘ question – looking for key areas, and watching how prices behave at those key levels.
So, the first thing to do is to learn how to recognize key levels.
Drawing lines on charts
One of the most powerful patterns in price action is the built-in “memory” that prices have.
Prices (well, it’s traders really) know where they stopped before, and they have a very strong tendency to stop in the same places again.
And these “lay bys” where prices stop, get out, stretch their legs and take a comfort break … crop up all over our charts.
Resistance is an area where the price was rejected and then fell back or consolidated. Support is an area from which price rebounded or consolidated.

Of course, prices don’t conveniently bounce around between two fixed lines of support and resistance – that would just make our lives too easy! Sometimes it moves straight on through these lines … and sometimes it fails to meet these levels at all.
However, if we know where these levels are – we can carefully watch for how the prices behave when they get near to them.
That way, we’re primed to act when we spot a signal that there’s a profit opportunity.
If you read a text book on support and resistance levels, it’ll probably tell you that you need at least two touches for it to count. While I agree that the more touches you get, the more powerful that level is – it’s a mistake to ignore one-touch levels, especially where they form significant market tops and bottoms.
What I’ll lay out here are the “rules” for drawing lines of support and resistance. However, my advice it to look at these … look at real charts … and use your discretion.
It’s not difficult to draw S & R lines, but it is something that you get better (and faster) at with practice.
1. The market needs to get rejected at least twice for it to count as support/resistance
2. The more often your level is tested, the more valid it becomes.
3. The more recently a level has been tested, the stronger its support or resistance.
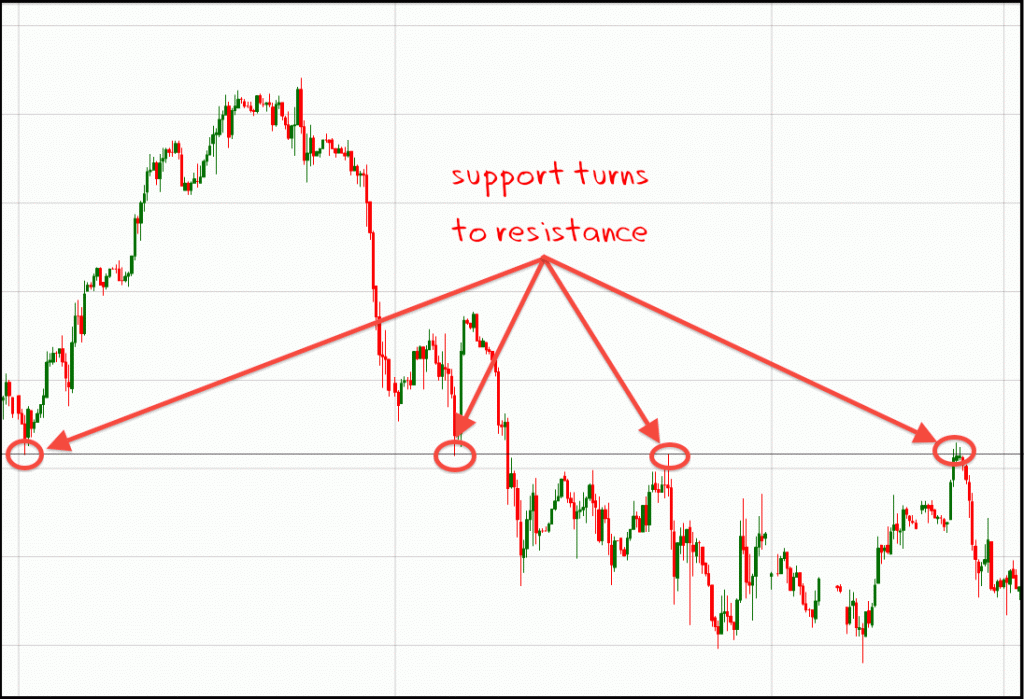
4. If support is broken, that level becomes resistance. Likewise, if resistance is broken, that level becomes support.
One of the main areas of “discretion” that I apply is just how fat my line of support or resistance is. It would be nice if prices repeatedly bounced of exact levels, but they rarely do. Sometimes a price will spike through resistance, only to bounce back down … sometimes it’ll nearly hit support – by their very nature, areas of support and resistance are messy. This is where prices get confused – they don’t know whether to go up or down … traders are bullish … traders are bearish …. So don’t expect beautiful neat lines joining up the tops and bottoms of your candlesticks, like they do in the text books!
How to use those levels
So, we’ve got our support and resistance areas. We want to look for sell signals at resistance levels; and for buy signals at support levels. That way, we can ride the “bounces” – and take our profits.
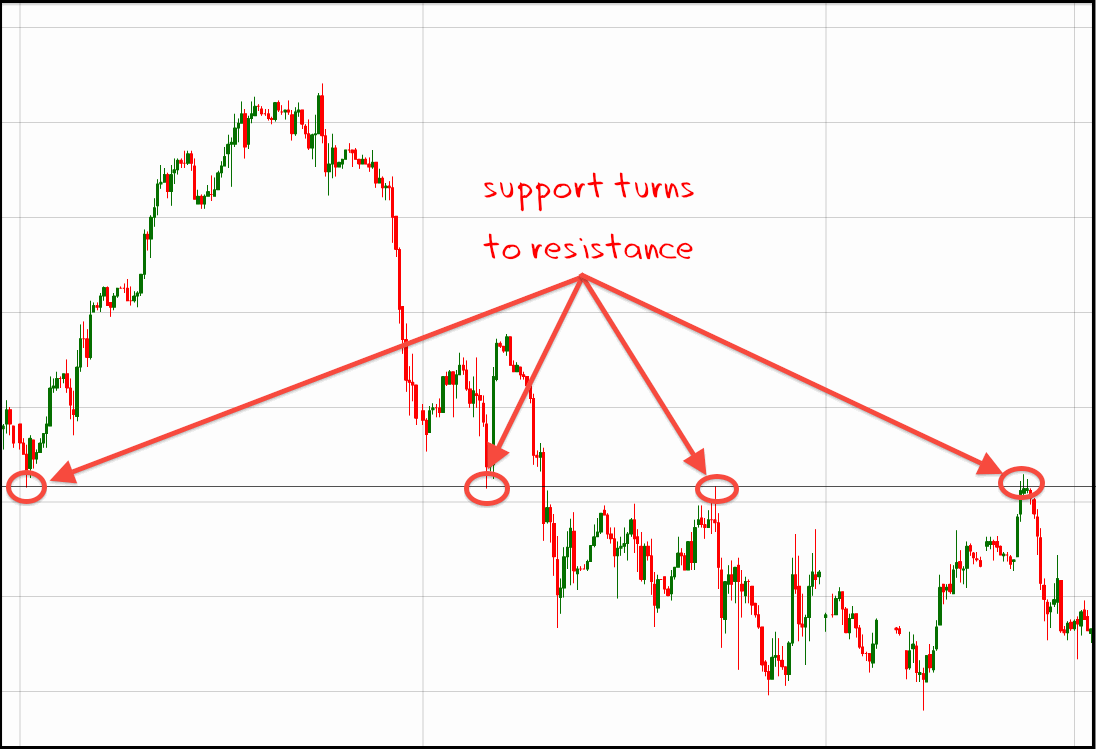
In this example, we can see an area of support turning into resistance after the price has broken below it.
Next, we’ll focus in on how the price behaved on those two occasions when it interacted with this resistance level …

If we look closely here, we’ll see the crucial candlestick that price-action traders love to see at a resistance level. Different traders have different names for this: a shooting start or a pinbar candle, but what’s important is that it has a small body and a long upward wick.
What this candlestick tells us is that the market, during that period (this is a one hour chart) was very bullish, but at some point during the hour, the bears came in and forced the price lower. It’s a clear signal of bearish sentiment overtaking bullish sentiment.
Being able to look at a candle and read the “story” of what happened during that time period is key to price-action trading. It takes a little practice, but I find reading candlesticks far more intuitive that learning what a MACD crossover means, or a parabolic SAR. And, what’s more, candlestick information is about NOW. Candlesticks give us immediate feedback of what’s happening in the markets.
If you’d like to find out more about price action trading, you can download my FREE ebook here.
Save
Save
Save









3 comments
Phil
Looking forward to the follow-up! I’d also love to hear whether these same techniques might apply to psychologically important levels such as round numbers or new highs and lows.
Mark Rose
Hi Phil, I can’t promise I’ll be coming back to this next week, but will definitely have more on the subject over the coming month. Yes, these techniques are definitely valid at key psychological levels – the only risk is that we end up covering our nice clean charts in lines again!
Laurie
Great post Mark! It’s easy to forget the fundamentals and taking the one hour charts and focusing on the obvious support and resistance levels makes it easy to trade at those levels. Of course, whether that trade works out as we reckon it will is another matter!