I haven’t talked a great deal about oil in Trader’s Bulletin over the last year, because – to be frank – it’s been pretty boring.
Sure, it’s wobbled up and down within its range, but it hasn’t really been going anywhere.
Until now.
That’s US crude, which this month has soared through the $100 level, and is back up at its fighting weight against the other big oil market: Brent crude (more on that in a moment).
If you’re not familiar with how the oil markets work, here’s a quick crib-sheet of what you need to know …
First off, the stuff we’re talking about is crude oil – this is the thick black goo that comes out of the ground. This is then refined to bring us the stuff we recognize as petrol, heating oil, plastics, etc.
When you look on your trading platform for oil, you’ll probably find two different prices on offer:
Brent Crude: This is the stuff coming out of the North Sea, and two thirds of the world’s internationally traded oil, from Europe, Africa and the Middle East is priced relative to UK Brent Crude.
US Light Sweet: despite sounding like something the wife puts in her coffee, this is actually the stuff that comes out of the ground on the other side of the Atlantic. Apparently is contains less sulphur, so has a “sweeter” smell. It’s also called US Crude or West Texas Intermediate.
Peak Oil: If we remember that oil is formed from the remains of marine animals and plants that lived millions of years ago before the dinosaurs, it is logical to assume that, at the rate we’re going, we’re going to deplete those resources. On the flip-side of that coin, we are constantly developing new and better ways to access hard-to-reach oil reserves. Peak oil theory is the science of trying to work out just when global oil production will hit a peak and then start to decline.
OPEC: This is the Organization of the Petroleum Exporting Countries. It hosts regular meetings among the oil ministers of its member countries with the principal goal of safeguarding its members’ interests. Opec members collectively hold around 80% of the world’s crude oil reserves, so their ability to control the price of oil is considerable. If you are trading oil, you should keep an eye on the dates of OPEC meetings.
Crude oil inventories: every week, the US Department of Energy reports on the amount of crude oil stored in various facilities across the States. These numbers are important, because they can indicate supply and demand trends. If there’s an increase in inventories, in implies that demand is weaker than expected, or that supply is greater than expected. And vice versa.
Driving Season: Probably less of a price-driver these days, but it’s good to be aware that there is a date (Memorial Day weekend, 24th May this year) when Americans get into their gas-guzzling cars, fill up at the pump and go, well … driving … And they keep at it until September.
Okay, so that’s the basics on oil. But what’s currently driving prices up?
The first thing, is to put these price rises into context. There are different types of oil – the main ones being Brent Crude and US Crude, as mentioned above.
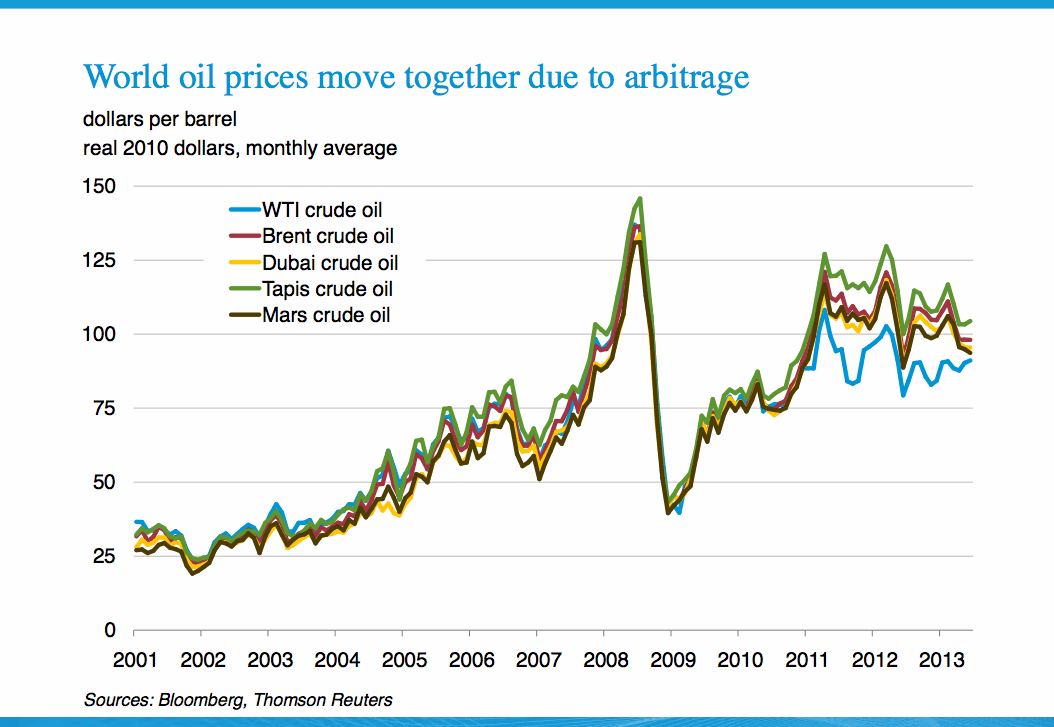
As you can see from the chart below, their prices all move pretty much in unison.
image:eia.gov
However, for the past couple of years, there’s been a marked gap in the price of WTI (US crude). It’s been moving up and down with the value of Brent, but at a much lower level.
Yet, over recent weeks, this differential has been closing up.
Why was WTI so cheap compared to other oil? The problem WTI has had is largely to do with storage problems in the US, at the main hub in Cushing, Oklahoma – there just isn’t enough of it.
New pipelines promise to reduce this bottleneck, but most oil investors have been surprised at the speed and scale at which WTI has caught up with Brent.
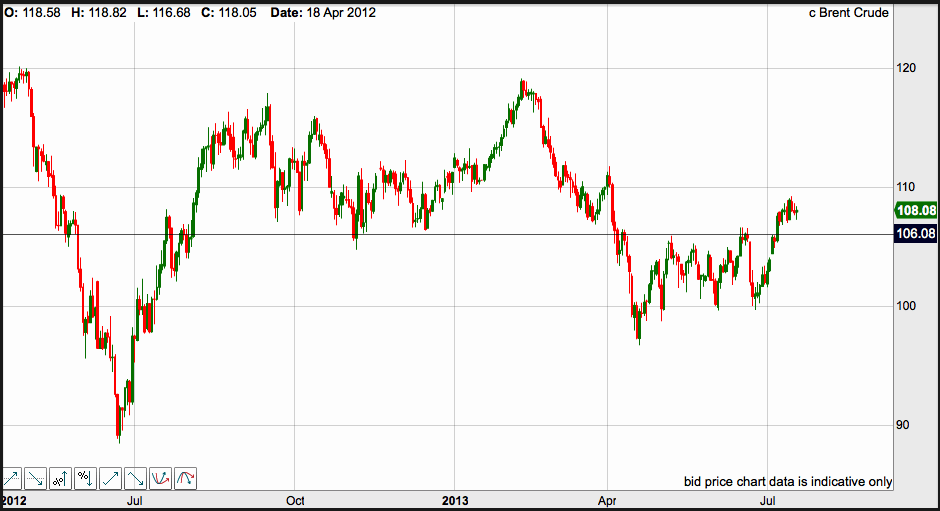
With that in mind, it’s worth looking at what kind of rise Brent crude has made over the same period …
While its gains haven’t been as meteoric, it’s clearly broken through resistance at $106.
So, what’s driving the price of oil up?
The quick response that most pundits come up with is political uncertainty in Egypt and Syria. Syria and Egypt aren’t major oil exporters, though. There’s been a lot of talk about access to the Suez canal being limited, but it’s really not in anyone’s interest to close the canal. Egypt makes around $5 billion a year in revenue from the canal.
The next driving force is supply. Last week, the US Energy Department reported crude oil stockpiles fell by nearly 10 million barrels. There have also been technical problems in pipelines between Iraq and Turkey.
On the other side of the fence, we have some serious economic slow-down that’s still affecting demand for oil. China’s oil imports were down in the first half of 2013, compared to the first half of 2012.
As the chart below shows, economic growth has a huge impact on the demand for oil.
image: www.eia.gov
So, we could uhm and ahh about what kind of curve we expect the global recovery to take … or we could look at the next chart, which harks back to what I was talking about last week – it’s the one factor that just keeps growing and growing in the global markets, and just won’t be argued with …
Correlation.
image: www.eia.gov
The chart above shows how oil prices are correlated to other markets, like equities, forex, bonds, etc. Red shows negative correlations (i.e. one goes up and the other goes down), while green shows positive correlations. What’s incredible is just how much this is growing, year on year.
This is exactly what I was talking about last week – this indicator is getting stronger and stronger. If we, as traders, don’t start using it – we’re missing a real trick.
Last week, I mentioned how well the MRP Strategy was using correlation in indices. What I didn’t tell you about is the new MRP Energy strategy that’s currently up and running (only available to long-term MRP users at the moment).
Just like it’s big cousin in the equities market, this correlation strategy is having incredible success in the energy sector, winning a fantastic 13 out of 13 trades since its launch.
Yesterday, I asked Trader’s Bulletin’s favourite correlation expert, Martin Carter, what he thought about the recent moves in the oil market:
“Before supply and demand became such a big driver of oil prices, WTI used to historically trade at a premium of about $20 a barrel based purely on it being “sweeter”. This meant that a lot more sell-able products could be produced out of it for less effort. The refining of the “sweeter” stuff was less intense, the refining process was a lot easier than the heavy old “Brent” stuff.
I wouldn’t be surprised to see this “correction” or “reversion” continue and the old drivers of oil prices re-establish again. I’m thinking that WTI could well get back to a very tasty premium to Brent.”
This means that MRP Energy can look forward to long and successful trends taking place and our indicator will be very well positioned to pick up good profit runs for our clients. The mix of short term and long term indicators should get us “out” when there is a blip but secure good profits at other times when WTI is trending.”