October 15, 2010by Mark Rose- 0 comments
How to read charts

Ever the art critic
I haven’t yet been to see this year’s offerings for the Turner Prize at the Tate. (I’m told that they are less controversial that usual.) But I did hear someone on Radio 4 waxing lyrical about the “raw human emotion” of Angela de la Cruz’s work.
Personally, I feel that I look at pictures of “raw human emotion” every day.
Where?
In charts.
I’m not saying that I want to hang a picture of a 5-minute FTSE chart over the fireplace in the living room – any more than I want Angela de la Cruz’s “Super Clutter XXL” in my front room – but I am saying that we should try to remember what we’re looking at when we view a chart.
Getting touchy-feely with charts
The psychology of the traders buying and selling is the force that moves the stock market. And a chart is a picture of these human emotions.
Look at a chart and you can read the emotions of greed, euphoria, fear, panic, hope …
They show the euphoria that traders feel when their stock goes up and up, and the greed that leads them to buy and buy at ever higher prices – ultimately creating a bubble, where a stock is overvalued.
They show us traders’ hopes when they anticipate good news, buying into a stock, which ends up falling when the good news is released, because expectations have been too high.
And they show us fear, as traders panic, offloading their stock at every cheaper prices, causing a sharp downward spike.
The successful trader is the one who can stand back and look objectively at the “big picture” – spotting where other traders are following their emotions, and keeping one step ahead of them.
How do we do this?
Fortunately, you don’t need a PhD in psychology to be successful in trading. What you do need, however, is a plan – and the discipline to stick to it.
The trader’s emotional cycle
As you learn to read charts, you come to recognize the range of human emotions they display.
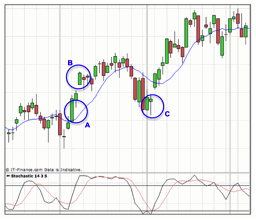
Here you can see breakout traders getting in at A … novice traders trying to catch the ride at B … and swing traders getting in at C.
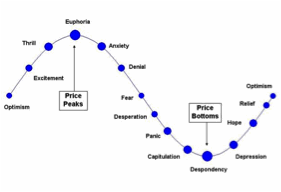
And this image of traders’ emotional cycle shows the turmoil we go through as prices move. The key thing to note here is that the moment of Euphoria, offers the worst profit potential, while the moment of despondency offers the greatest potential.
Individuals clearly follow this pattern in their decision-making process. And since large-cap stocks, indices and forex markets are comprised of the decisions of millions of individuals – we can fully expect prices to track this pattern as well.
Being aware of the cycle, and judging were we are within it, is half the battle won.
As for the rest of the battle …
If you want to make your trading more successful, I really urge you to watch out for my email report next week. This is the best opportunity I’ve come across in a long time to really get to grips with swing trading.
Until next week,
Mark Rose