February 18, 2011by Mark Rose- 0 comments
Four key strategies you can apply now

Last Friday I told you about how I apply the 200-day moving average to my trading. And today I’d like to talk about some other very effective ways to use moving averages.
MAs form the nuts and bolts behind a lot of more advanced technical analysis, but even in their simplest form, they can give a lot of sound information about price movement. Here are some very fundamental ways to apply them in your trading …
The crossover
This is the most basic signal that traders look for from a moving average (and is essentially what I was talking about last week in relation to the 200-day MA).
If a price is rising, we expect it to be above the moving average; if it is falling, we expect it to be below the moving average.
Therefore, if a price crosses the moving average line, we can anticipate a change in trend.
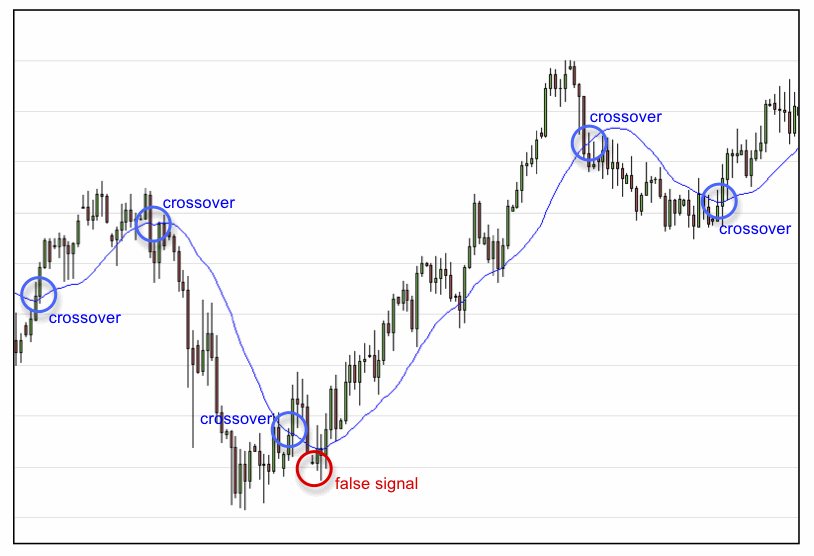
Here we see a price crossing back and forth over a 20-day moving average. Over the period here we can see six signals, one of which is a false one.
A 20-day MA is relatively short-term. If you want to avoid whipsaw signals, you’d do better to look for a longer-term MA. However, something like the 200-day moving average that we looked at last week is very slow to react.
By playing around with different timescales, you can find a moving average that best suits your style of trading. In fact, many traders find that a combination of two or three moving averages works best for them …
The double crossover
The double crossover works on the philosophy that if one moving average is good – two are better!
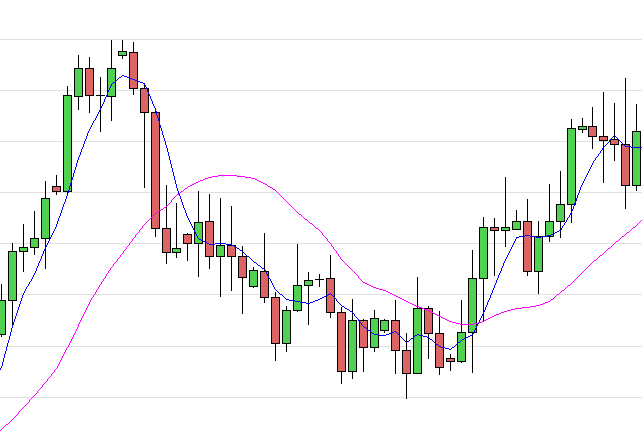
Here, where the shorter-term MA crosses below the longer-term MA, we see a downtrend forming. And where the shorter-term MA crosses above the longer-term MA, we see an uptrend forming.
One of the great things about a double crossover is that it’s impossible to miss or be in any doubt about.
The ribbon
If one MA is good, and two are better – why not use three, or four, or twenty?
Sticking a whole bunch of moving averages onto your charts is called a moving average ribbon, and you can see why:

It definitely looks quite pretty – but just how helpful is it?
You can clearly see on these charts how the shorter-term MAs react much more quickly to a trend change than a longer-term MA – and the ribbon allows you to judge your trade timing accordingly.
This gets to the rub with moving averages – the shorter-term ones give us an earlier signal, but can be prone to false signals. The longer-term ones are more reliable, but a later entry means missed profits.
In a bid to get around this problem, many traders apply filters …
The envelope
By adding a further criteria, traders hope to filter out whipsaws on moving average crossovers. Therefore, you can add an envelope around the MA line. For example, you could require that a price must cross the 20-day moving average PLUS be a further 5% above that line before you will place your trade.
The result is that your moving average line instead becomes a channel that the price moves within – it the price breaks out of this channel, then a trend change is indicated.
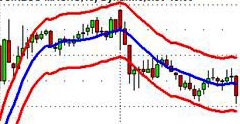
It is exactly this theory that John Bollinger enhanced in the 1980s to create Bollinger bands. If you’re interested in finding out more about Bollinger bands, I recommend that you have a quick glance back though our Trader’s Bulletin archives: click here.