September 7, 2012by Mark Rose- 0 comments
Be careful how you read the “Fear Index”
If the general consensus among traders is that September is a month to be fearful, then why does the “Fear Index”, which is supposed to tell us how nervous traders are, start the month on a 5-year low?
In fact, this year has seen some of the lowest “fear” readings since the financial crisis began.
Is the worst over?
Are traders breathing a collective sigh of relief?
Or has the Fear Index has simply stopped working?
What is the Fear Index?
The real name of the “fear index” is the CBOE Market Volatility Index, but it’s usually referred to by its ticker symbol: VIX.
The VIX was first established in 1993, and it is calculated on a weighted blend of prices for a range of options on the S&P calls and puts. The method of calculation is a little complex, but we don’t usually worry about that – we simply need to understand that, in essence, it is a gauge of investors’ confidence in the market.
The VIX, in general, has an inverse relationship to the market. The VIX goes up as stocks decline, and the VIX declines as stocks advance. A low VIX means that traders are confident about market conditions. A high VIX means that they are fearful.
The reasoning behind this is that a rising market is inherently viewed as less risky, while declining stocks tend to go hand in hand with volatility.
What makes the VIX special is that it does claim to have predictive powers, measuring expected volatility over the coming 30 days …
Because of the close association of volatility with falling markets, the VIX is often used to predict bottoms on the S&P. So, if the VIX is rising, we expect to see the S&P falling. And if the VIX is falling, we expect to see the S&P rising.
This chart shows how the two instruments correlate to each other …

This compares the VIX reading with the S&P. As you can see, spikes on the VIX closely correlate to tops and bottoms on the S&P.
So, let’s take a look at what the VIX is doing at the moment …
VIX in decline
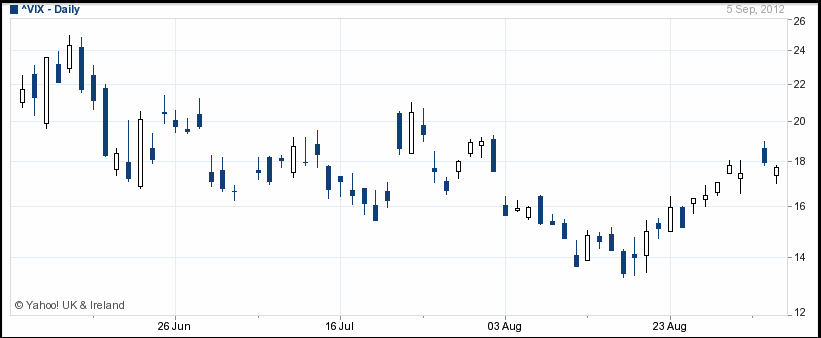
Since mid June, the VIX has been in a downward trend, and even its current spike above the 18 level still represents a very low reading.
It hit its five-year low of 13.45 on August 17, a level not seen since June 2007, when the closing value of the VIX was 12.85 (just ahead of the sub-prime crash).
These recent lows have many investors making predictions … that such a low VIX reading must be a sign of investor complacency and a signal for a market top.
However other investors are taking a different tack … they are asking whether the VIX is no longer working as it used to.
So far this year, the VIX has been averaging high teens, compared to its normal average in the low to mid 20s.
Why has the market become so fearless?
Have investors just become desensitized to the Eurozone crisis … the Chinese economic slowdown … the fiscal problems in the US …?
It’s important to remember here what it is that the VIX is measuring – it’s measuring volatility, and we are making the association between volatility and fear.
So the question should be, what’s happened to volatility?
According to an article in International Financing Review, “Baseline volatility – the amount the market moves on an average, non-event day – has plummeted over the past four years, according to the report. The median daily move for the S&P 500 index has dropped from over 1% in 2008 to just 0.4% so far this year, despite large daily moves occurring at a consistent rate over the last few years.”
According to Gerry Fowler of BNP Paribas, the “risk-on, risk-off environment has reached such an extreme stage that investors are only really active – and so produce a lot of market volatility – on the very few days there is a market event. This means that all the other ’average’ days during the year have become less and less volatile.”
This “new normal” behaviour from traders is weighing down the volatility readings on the VIX. So, we should be wary of making pronouncements (as I did at the beginning of this email) like: the 18 level still represents a very low reading.
How to read the VIX
So, the “low” readings we’re seeing on the VIX don’t necessarily mean that we’ve hit a top in equity markets. Nor that we should all rush into long volatility positions.
Bernanke’s speech on Friday seemed to reaffirm more quantitative easing ahead, which should be sufficient to keep equity markets buoyant, and keep the VIX down.
Personally, I’ll be trying my best to avoid reading the figures on the axis up the side of my VIX charts, but instead simply watching to see if it’s going up or down.







