February 11, 2011by Mark Rose- 1 comment
200 day moving average: a signal that won’t let you down

Many writers like to put a photo of themselves at the top of their newsletters. It’s an idea that I resisted for a long time – I prefer to think of readers imagining me as sickeningly handsome, sharply dressed and driving a very flash car – a kind of Daniel Craig of the spread-betting world.
The truth is, however, that I generally turn up to work sporting “a nice warm jumper” (thankfully not knitted by my mother!) and driving a Volvo estate.
The trusty family Volvo – complete with crisps trodden into the floor and Wethers Originals stuck down the back of the seats – lacks much in speed and style. Yet it has always made up for it in reliability – it’s the car that has carried me effortlessly up snowy Alpine tracks, has pulled a friend’s Porsche 911 out of a muddy ditch, and – almost – had the birth of my youngest son on its back seat in a mad midnight dash to the hospital!
Slow, steady, but reliable.
Slow and sure
These are qualities I also appreciate in my trading.
Short-term candlestick patterns, and leading indicators like Stochastics are excellent in their place, but if you want something you can really depend on, you’re going to have to look for a slow, lagging indicator.
And if you want the Volvo estate of the technical indicators, it would have to be the 200-day moving average.
If you’ve been following my emails, you’ll already know how much I rate moving averages.
In my opinion, if you’re going to have any piece of technical analysis on your charts it should be a moving average. And if you’re not using moving averages – you’re missing a trick.
The problem traders run into with these is which one to use for different situations. So, today, I’m going to take a look at the trusty 200-day MA.
What is a moving average?
A simple moving average is created by adding up the closing prices of “x” number of days, and then dividing them by “x”. So, a 200-day MA is the average closing price over 200 days; the 50-day MA is the average closing price over 50 days … and so on.
The lines these figures plot onto a chart will show us trends, with the daily “noise” taken out. A 20-day MA will show the short-term trend; the 50-day MA will show the medium-term trend; and the 200-day MA will show the long-term market trend.
Because moving averages are created by looking at past data, they are lagging indicators – i.e. they tell us about what has happened, rather than about what is going to happen.
When a price is in an uptrend, it is most likely to be sitting above the moving average line. When it’s in a downtrend, it’ll be below the moving average.
Therefore, when a price crosses a moving average line – it suggests that a trend change has occurred.
If the price crosses a 20-day MA, it’s a bit like a car turning a corner. But if it crosses a 200-day MA – it’s more like an oil tanker changing direction!
Here’s a chart for AUD/USD over three years …
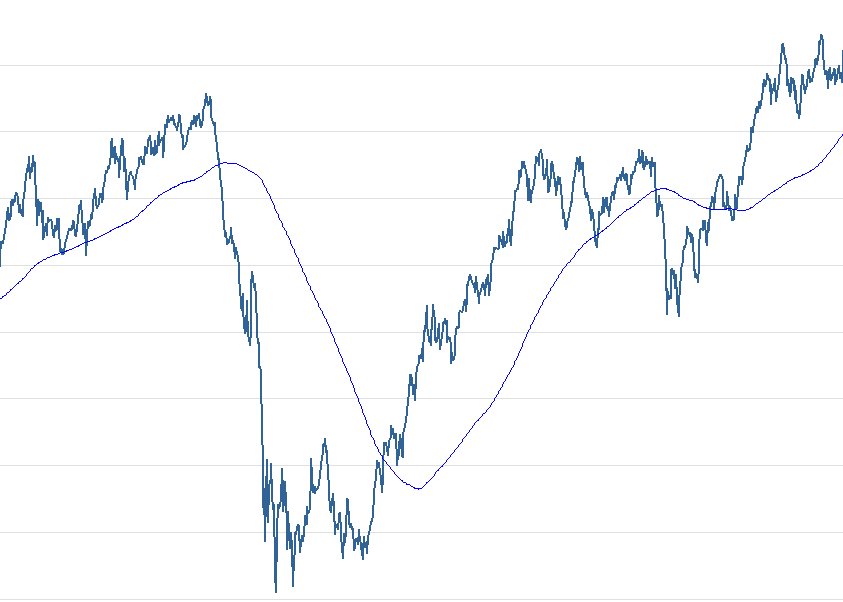
As you can see, the 200-day MA isn’t immune to whipsaws, and it’s certainly not fast out of the gates – but it does offer a very reliable indicator of market sentiment.
Where the price is in relation to the 200-day MA determines long-term market psychology – whether the bulls or the bears are in charge.
Why should you care about long-term trends?
You may be thinking “I’m a day trader – why should I care about long-term market trends?”
If the market is in a long-term uptrend, it will spend more time going up than down. This means that you’ll have a greater chance of success if you look for buying opportunities in that market.
If the market is in a long-term downtrend, it will spend more time going down than up. Therefore, you’ll improve your chance of profiting by looking for selling opportunities.
It’s the old “follow the trend” adage.
And yet, it’s exactly this kind of conventional wisdom that can be forgotten when we have our heads buried in short-term charts, watching leading indicators and looking for pips to scalp.
Save
Save
Save








1 comment
Paul H
Mark, I share your enthusiasm for the 200 MA especially on the lower time frames. If one plots the 200 MA on the 15 min or 30 min time frame, it tells us immediately whether one should be long or short, or whether to wait for price to be on the right side of the MA to align with trend on say the daily time frame. It is a useful filter on any trade.