November 5, 2010by Mark Rose- 0 comments
A market timer that really works

Now that we’re into November, you can almost hear the buy-and-hold investors around the globe breathe a collective sigh of relief. The “September effect” is behind us, and October – a word filled with ghosts of market crashes past – is over.
All that remains is the “Halloween indicator” to cash in on …
Most traders have heard of the old adage “Sell in May and go away.” Well, the Halloween indicator is simply the flip side of the same coin – i.e. the time to start buying again.
Just by calling it the Halloween indicator suggests that it’s a load of mumbo-jumbo – a bit like looking for stock-market tips in your tea leaves.
Well, don’t be fooled by the association with pumpkins and witches … the Halloween indicator is one of the very few market timing devices that actually appears to work.
Most popular market indicators are thrown at traders with little or no statistical evidence to back them up. And that’s what makes the Halloween indicator different – this isn’t based on some anecdotal evidence. This isn’t even looking back over the past 20 years …
The Halloween effect is significant over 317 years worth of back-testing!
A risk-reduction exercise
So, what does the Halloween indicator tell us to do?
Dead simple, really: you buy into the equity markets in November, and get out of them in April, putting your money into a risk-free investment. In this way you take advantage of the market gains during the winter months, but substantially reduce your risk by being out of the market for 6 months of the year.
If you’re wondering what you’ll be missing out on in the summer months – the answer appears to be: “not much”. According to the 2005 edition of the Stock Trader’s Almanac, the six-month period beginning in November gained 10,599.68 Dow Jones Industrial Average points in 54 years. The remaining six months, from the beginning of May through the end of October, lost 588.44 points in the same period.
Three centuries of trading experience
So, what of that 317 years of data …
The first major scientific study into this effect was done back in 2002 at a New Zealand University by Ben Jacobsen. This found the effect to be strong in 36 out of 37 developed and emerging markets. And this year, Jacobsen is back with further evidence in a new study that answers a lot of the questions left hanging by the first paper.
Looking at 317 years of results from the UK market – that’s basically the entire history of the UK equity market – he’s found that the winter months (November–April) consistently outperform the summer months (May–October).
Of course, the Halloween indicator doesn’t work every year – notable exceptions are the oil embargo of 1973–74, the dot-com bust of 2000–01, and the financial crash of 2007–09 – no market signal can be right 100% of the time.
However, the longer the investment horizon, the stronger the indicator became: the Halloween indicator beat the market in 71% of all two-year periods since 1693; in 82% of all five-year periods; and in 92% of all 10-year periods.
The chart below shows end-of-period wealth (not including dividends) for the buy-and-hold strategy and the Halloween strategy for the period of 1693 to 2009.
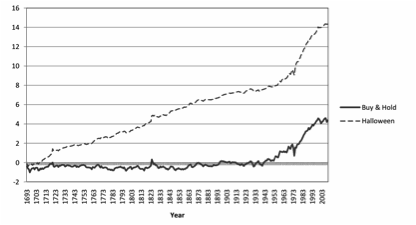
The contrast is impressive, but there remains a nagging doubt in my mind about the Halloween indicator.
My issue is that no one can explain to me why the Halloween effect exists. In all the research, no one has answered the question, which means that this could still be a statistical fluke. Over 300 years of data sounds impressive, but when you’re looking for yearly trends, this is actually a relatively modest sample.
I suspect that Mark Twain may have got to the heart of the matter: “October. This is one of the peculiarly dangerous months to speculate in stocks. The others are July, January, September, April, November, May, March, June, December, August, and February.”
But then Twain was a bankrupt by the age of 59!
Taking requests
Over the weeks in Trader’s Bulletin, as well as highlighting interesting investment opportunities that I uncover, I also like to examine trading indicators – like the Halloween effect – and bits and pieces of technical analysis that I’ve found useful and think might be helpful to you.
I’m often asked by readers to compile this information into a form that will be easy for people to look back through, as a reference tool. For that reason, over the coming months, I will be putting together a series of “cheat sheets”, on subjects like technical analysis, trading psychology, candlesticks, resources, and more.
If there’s anything you’d like me to cover, please drop me a line at the usual address: support@tradersbulletin.co.uk, and I’ll try to include it.
Until next time,
Mark Rose
Resources: Jacobsen, Ben and Zhang, Cherry Yi, Are Monthly Seasonals Real? A Three Century Perspective (October 25, 2010). Available at SSRN: http://ssrn.com/abstract=1697861